atmospheric river
A long, narrow, and transient corridor of strong horizontal water vapor transport that is typically associated with a low-level jet stream ahead of the cold front of an extratropical cyclone. The water vapor in atmospheric rivers is supplied by tropical and/or extratropical moisture sources. Atmospheric rivers frequently lead to heavy precipitation where they are forced upward—for example, by mountains or by ascent in the warm conveyor belt. Horizontal water vapor transport in the midlatitudes occurs primarily in atmospheric rivers and is focused in the lower troposphere. Atmospheric rivers are the largest "rivers" of fresh water on Earth, transporting on average more than double the flow of the Amazon River.
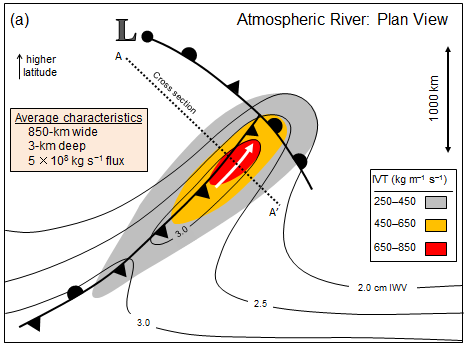
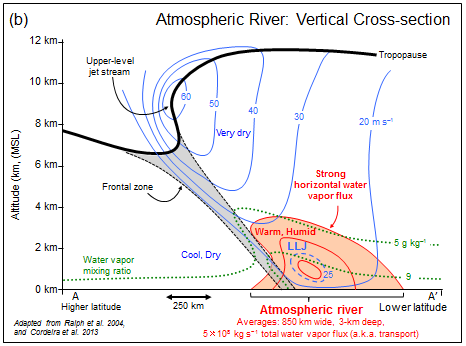
Fig. 1. Schematic summary of the structure and strength of an atmospheric river based on dropsonde measurements deployed from research aircraft across many atmospheric rivers and on corresponding reanalyses that provide the plan-view context. Magnitudes of variables represent an average midlatitude atmospheric river. Average width is based on atmospheric river boundaries defined by vertically integrated water vapor transport (IVT; from surface to 300 hPa) lateral boundary threshold of 250 kg m−1 s−1. Depth corresponds to the altitude below which 75% of IVT occurs. The total water vapor transport (a.k.a. flux) corresponds to the transport along an atmospheric river, bounded laterally by the positions of IVT = 250 kg m−1 s−1 and vertically by the surface and 300 hPa. (a) Plan view including parent low pressure system and associated cold, warm, and warm-occluded surface fronts. IVT is shown by color fill (magnitude; kg m−1 s−1) and direction in the core (white arrow). Vertically integrated water vapor (IWV; cm) is contoured. A representative length scale is shown. The position of the cross section shown in (b) is denoted by the dashed line A–A′. (b) Vertical cross-section perspective, including the core of the water vapor transport in the atmospheric river (orange contours and color fill) and the pre-cold-frontal low-level jet (LLJ), in the context of the jet-front system and tropopause. Water vapor mixing ratio (green dotted lines; g kg−1) and cross-section-normal isotachs (blue contours; m s−1) are shown. [Schematic is from Ralph et al. (2017). It was prepared by F. M. Ralph, J. M. Cordeira, and P. J. Neiman based on the composite of research-aircraft-based observations of 21 atmospheric rivers presented in Ralph et al. (2017), including adaptations of earlier results from Ralph et al. (2004), Cordeira et al. (2013), and others. The 21 observed cases were compared with thousands of ARs found in ERA and MERRA-2 over 37–38 years in the same region and season (Guan et al. 2018). The composite of the 21 aircraft-observed cases was shown to be representative of the broad spectrum of ARs in the reanalyses.]
Cordeira, J. M., F. M. Ralph, and B. J. Moore, 2013: The development and evolution of two atmospheric rivers in proximity to western North Pacific tropical cyclones in October 2010. Mon. Wea. Rev., 141, 4234–4255, https://doi.org/10.1175/MWR-D-13-00019.1.
Guan, B., D. E. Waliser, and F. M. Ralph, 2018: An intercomparison between renalysis and dropsonde observations of the total water vapor transport in individual atmospheric rivers. J. Hydrometeor., 19, 321–337, https://doi.org/10.1175/JHM-D-17-0114.1.
—, and —, 2015: Detection of atmospheric rivers: Evaluation and application of an algorithm for global studies. J. Geophys. Res. Atmos., 120, 12 514–12 535, https://doi.org/10.1002/2015JD024257.
Neiman, P. J., F. M. Ralph, G. A. Wick, J. D. Lundquist, and M. D. Dettinger, 2008: Meteorological characteristics and overland precipitation impacts of atmospheric rivers affecting the West Coast of North America based on eight years of SSM/I satellite observations. J. Hydrometeor., 9, 22–47, https://doi.org/10.1175/2007JHM855.1.
Ralph, F. M., P. J. Neiman, and G. A. Wick, 2004: Satellite and CALJET aircraft observations of atmospheric rivers over the eastern North Pacific Ocean during the winter of 1997/98. Mon. Wea. Rev., 132, 1721–1745, https://doi.org/10.1175/1520-0493(2004)132<1721:SACAOO>2.0.CO;2.
—, and Coauthors, 2017: Dropsonde observations of total water vapor transport within North Pacific atmospheric rivers. J. Hydrometeor., 18, 2577–2596, https://doi.org/10.1175/JHM-D-17-0036.
Zhu, Y., and R. E. Newell, 1998: A proposed algorithm for moisture fluxes from atmospheric rivers. Mon. Wea. Rev., 126, 725–735, https://doi.org/10.1175/1520-0493(1998)126<0725:APAFMF>2.0.CO;2.
río atmosférico[edit | edit source]
Corredor largo, estrecho y transitorio de transporte horizontal de vapor de agua intenso que normalmente se asocia con una corriente en chorro de bajo nivel por delante del frente frío de un ciclón extratropical. El vapor de agua en los ríos atmosféricos lo suministran fuentes de humedad tropicales o extratropicales. Los ríos atmosféricos con frecuencia conducen a fuertes precipitaciones donde se ven obligados a ascender, por ejemplo, por montañas o por ascenso en la cinta transportadora cálida. El transporte horizontal de vapor de agua en latitudes medias principalmente ocurre en ríos atmosféricos y se centra en la troposfera inferior. Los ríos atmosféricos son los "ríos" de agua dulce más grandes de la Tierra y, en promedio, transportan más del doble del caudal del río Amazonas.
Fig. 1. Resumen esquemático de la estructura y la fuerza de un río atmosférico con base en mediciones de radiosondas con paracaídas desplegadas desde aviones de investigación a lo largo de muchos ríos atmosféricos y en análisis repetidos correspondientes que proporcionan el contexto de vista en planta. Las magnitudes de las variables representan un río atmosférico de latitud media. El ancho promedio se basa en los límites atmosféricos de los ríos definidos por el transporte de vapor de agua integrado verticalmente (IVT, desde la superficie hasta 300 hPa) umbral de límite lateral de 250 kg m−1 s−1. La profundidad corresponde a la altitud por debajo de la cual se produce el 75 % del IVT. El transporte total de vapor de agua (también conocido como flujo) corresponde al transporte a lo largo de un río atmosférico, delimitado lateralmente por las posiciones del IVT = 250 kg m−1 s−1 y verticalmente por la superficie y 300 hPa. (a) Vista en planta que incluye el sistema de baja presión principal y frentes de superficie asociados fríos, cálidos y cálidos ocluidos. El IVT se muestra por relleno de color (magnitud; kg m−1 s−1) y dirección en el núcleo (flecha blanca). El vapor de agua integrado verticalmente (IWV; cm) está contorneado. Se muestra una escala de longitud representativa. La posición de la sección transversal que se muestra en (b) se indica mediante la línea discontinua A-A′. (b) Perspectiva de la sección transversal vertical, incluido el núcleo del transporte de vapor de agua en el río atmosférico (contornos naranjas y relleno de color) y el chorro de bajo nivel prefrontal en frío (LLJ), en el contexto del sistema de frente de chorro y la tropopausa. Se muestran la proporción de mezcla de vapor de agua (líneas discontinuas verdes; g kg-1) y los isotacos normales de sección transversal (contornos azules; m s-1). [El diagrama esquemático es de Ralph et al. (2017). Lo prepararon F. M. Ralph, J. M. Cordeira y P. J. Neiman con base en la composición de observaciones basadas en aviones de investigación de 21 ríos atmosféricos presentados en Ralph et al. (2017), incluidas las adaptaciones de resultados previos de Ralph et al. (2004), Cordeira et al. (2013) y otros. Los 21 casos observados se compararon con miles de RA encontrados en ERA y MERRA-2 durante 37 a 38 años en la misma región y estación del año (Guan et al. 2018). La composición de los 21 casos observados en aeronaves demostró ser representativa del amplio espectro de RA en los análisis repetidos].
Term edited 14 March 2022.


